[ad_1]
Buyers are proving to be the big winners in Australia’s used vehicle market, as a record number of cars changed hands last month.
Data compiled by AutoGrab and published by the Australian Automotive Dealer Association (AADA) shows 214,588 used vehicles were sold throughout July, an 11.6 per cent increase on the month before.
This represents the third month in a row that the monthly sales figure has reached a new high since the AADA’s Automotive Insights Report (AIR) debuted at the end of 2023.
The sales jump came amid a significant 5.8 per cent reduction in used car listings, with private sellers accounting for 69.1 per cent of those trying to offload their vehicles.
There’s good news for sellers too, with the average number of days it takes for a car to be sold continuing to fall, reaching a new low of 43.6 – well down on the high of 52 days in November.
According to AADA CEO James Voortman, the sales uptick was influenced not only by lower prices but also better supply, as the new vehicle market also experienced an increase in deliveries.
“With the commencement of the new financial year, buyers have flocked to the used car market taking advantage of better supply and lower prices as they make an effort to escape the rising cost-of-living pressures,” said Mr Voortman.
All states and territories bar the Northern Territory experienced a sales increase, though being the smallest market, its 15.6 per cent dip didn’t have a noticeable effect on the overall result.
There was a consistent 12-13 per cent increase in sales of petrol, hybrid, electric (EV) and LPG-powered vehicles, with diesels also rising by nine per cent as plug-in hybrids (PHEVs) – still a niche player – jumped by a massive 28.6 per cent.
Traditional passenger vehicles such as sedans, hatchbacks and wagons prove to be the choice of used car buyers, accounting for more than 40 per cent of all sales, with the gap to SUVs also widening this month.
As has been the case throughout the year, the Ford Ranger is the used vehicle of choice among Australian buyers, however its popularity dropped slightly by 2.4 per cent – the only vehicle in the Top 10 to not experience an increase.
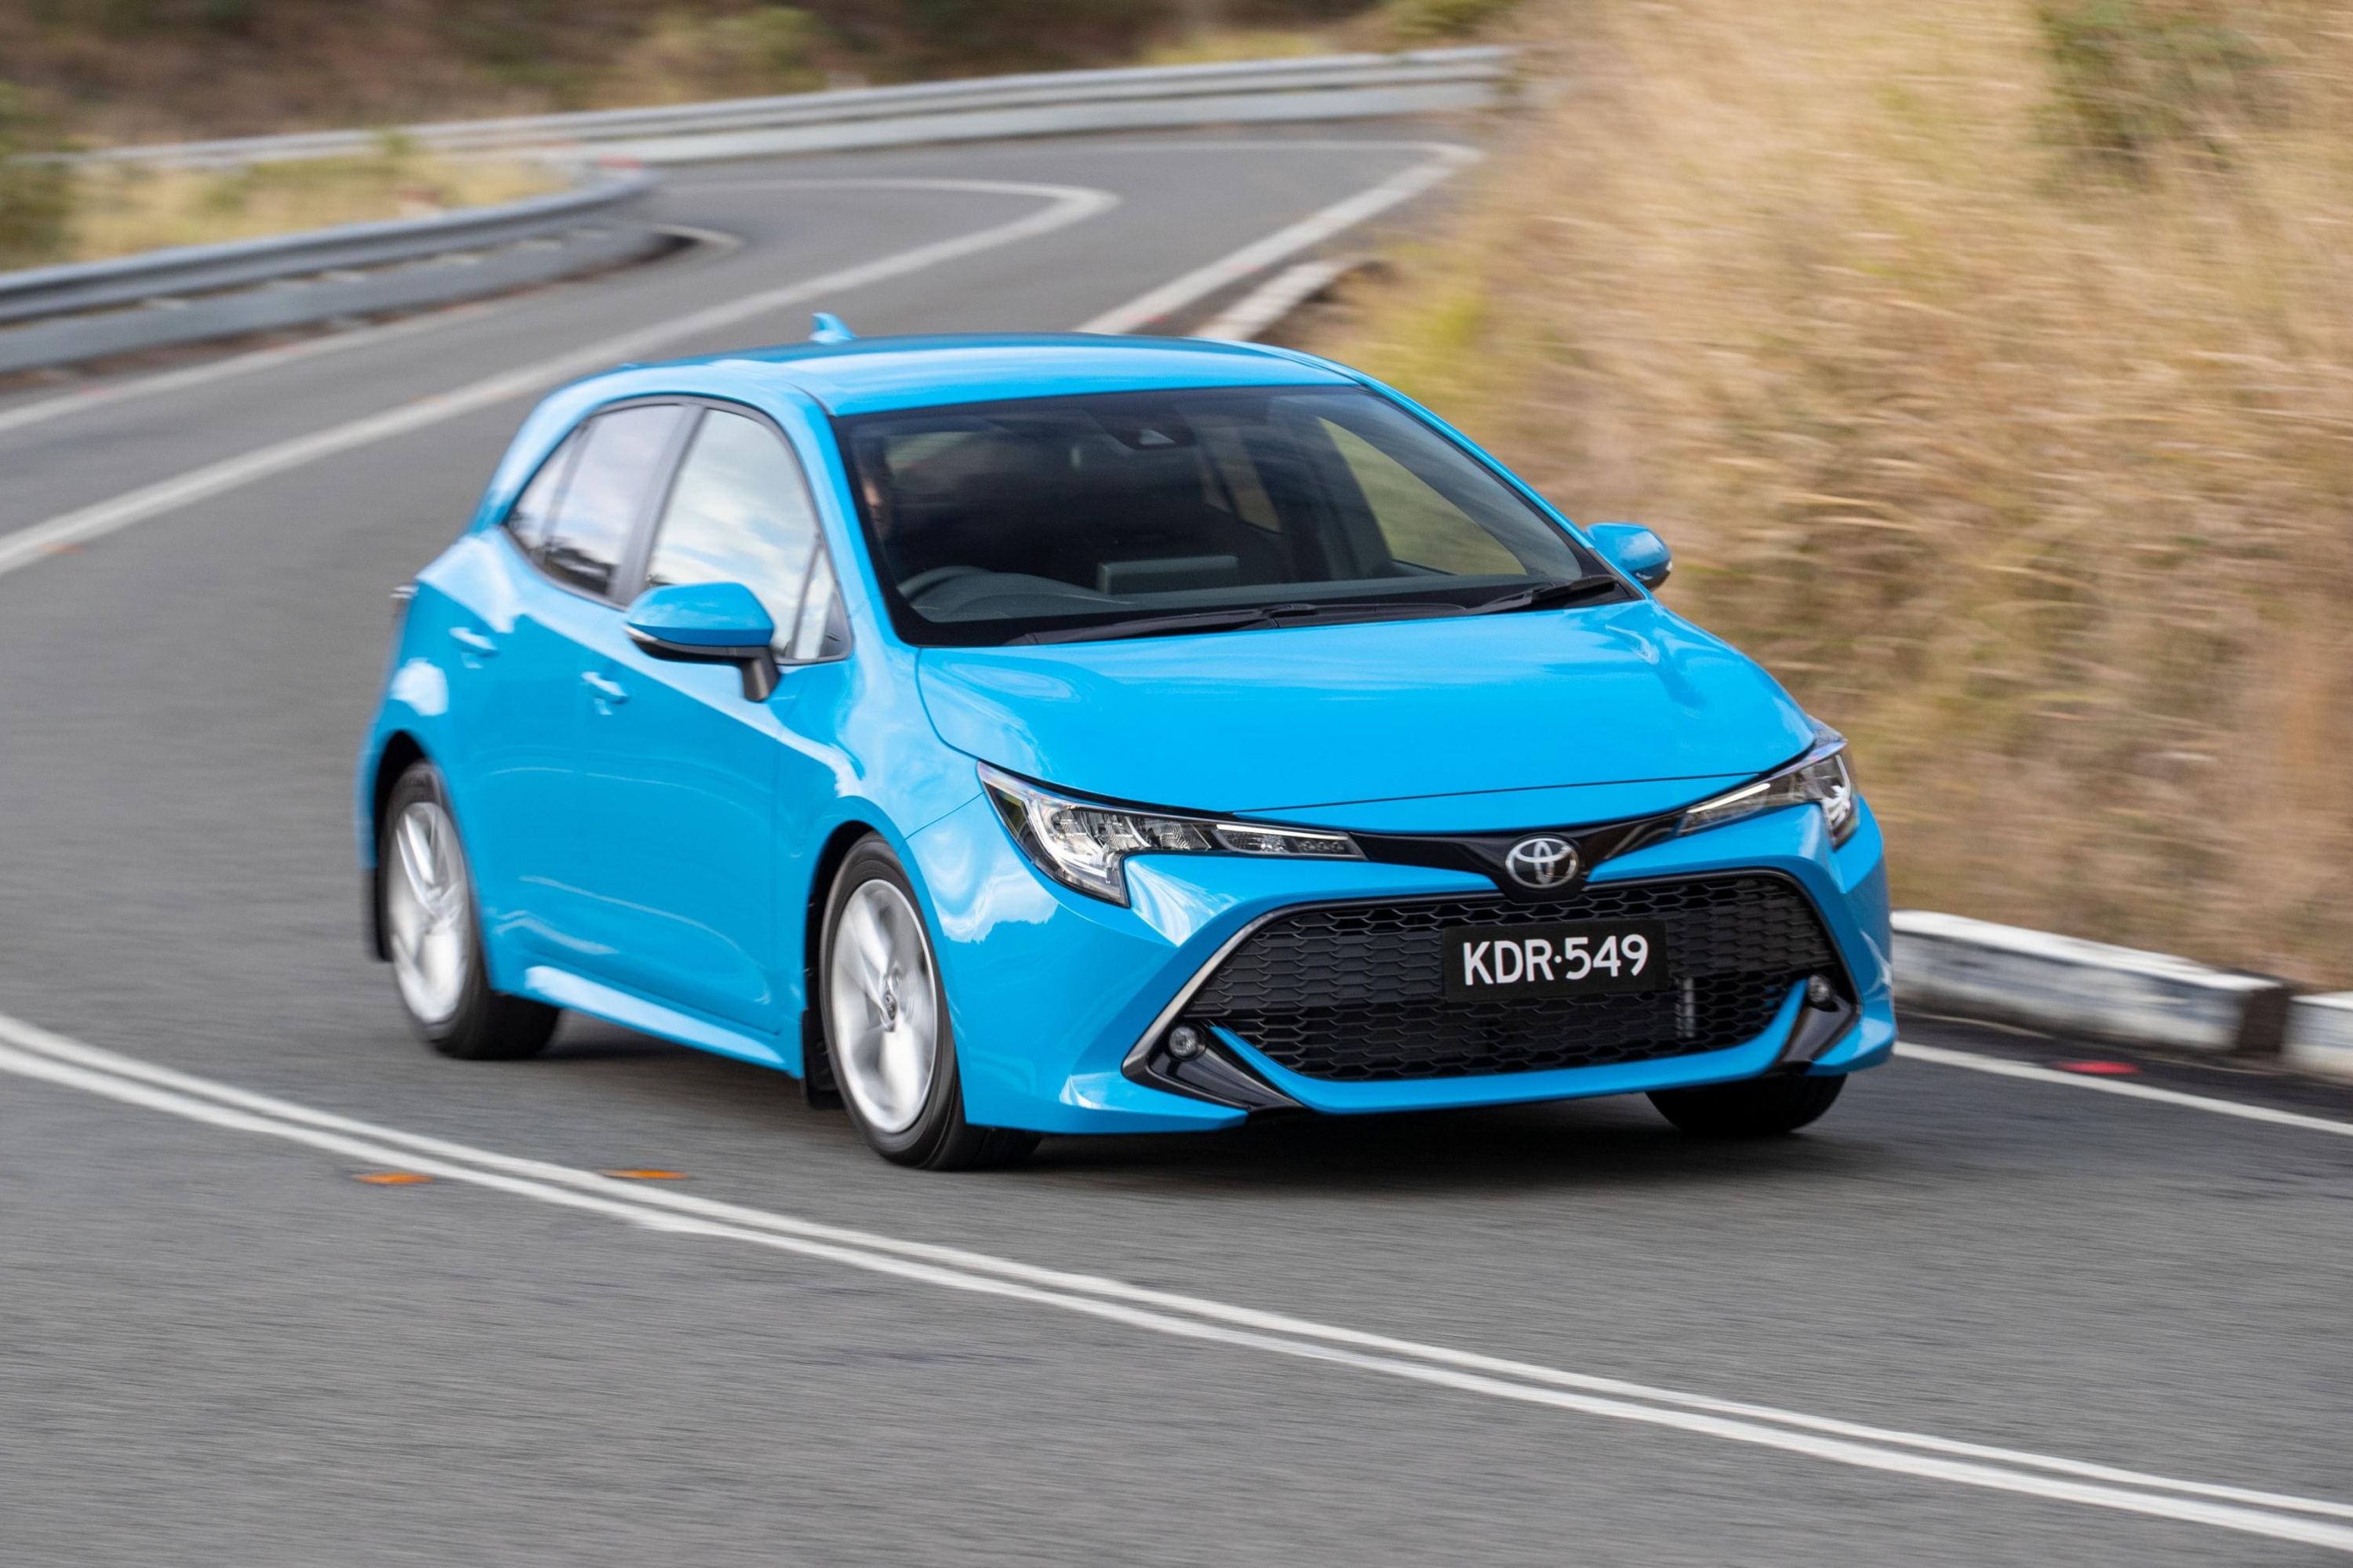
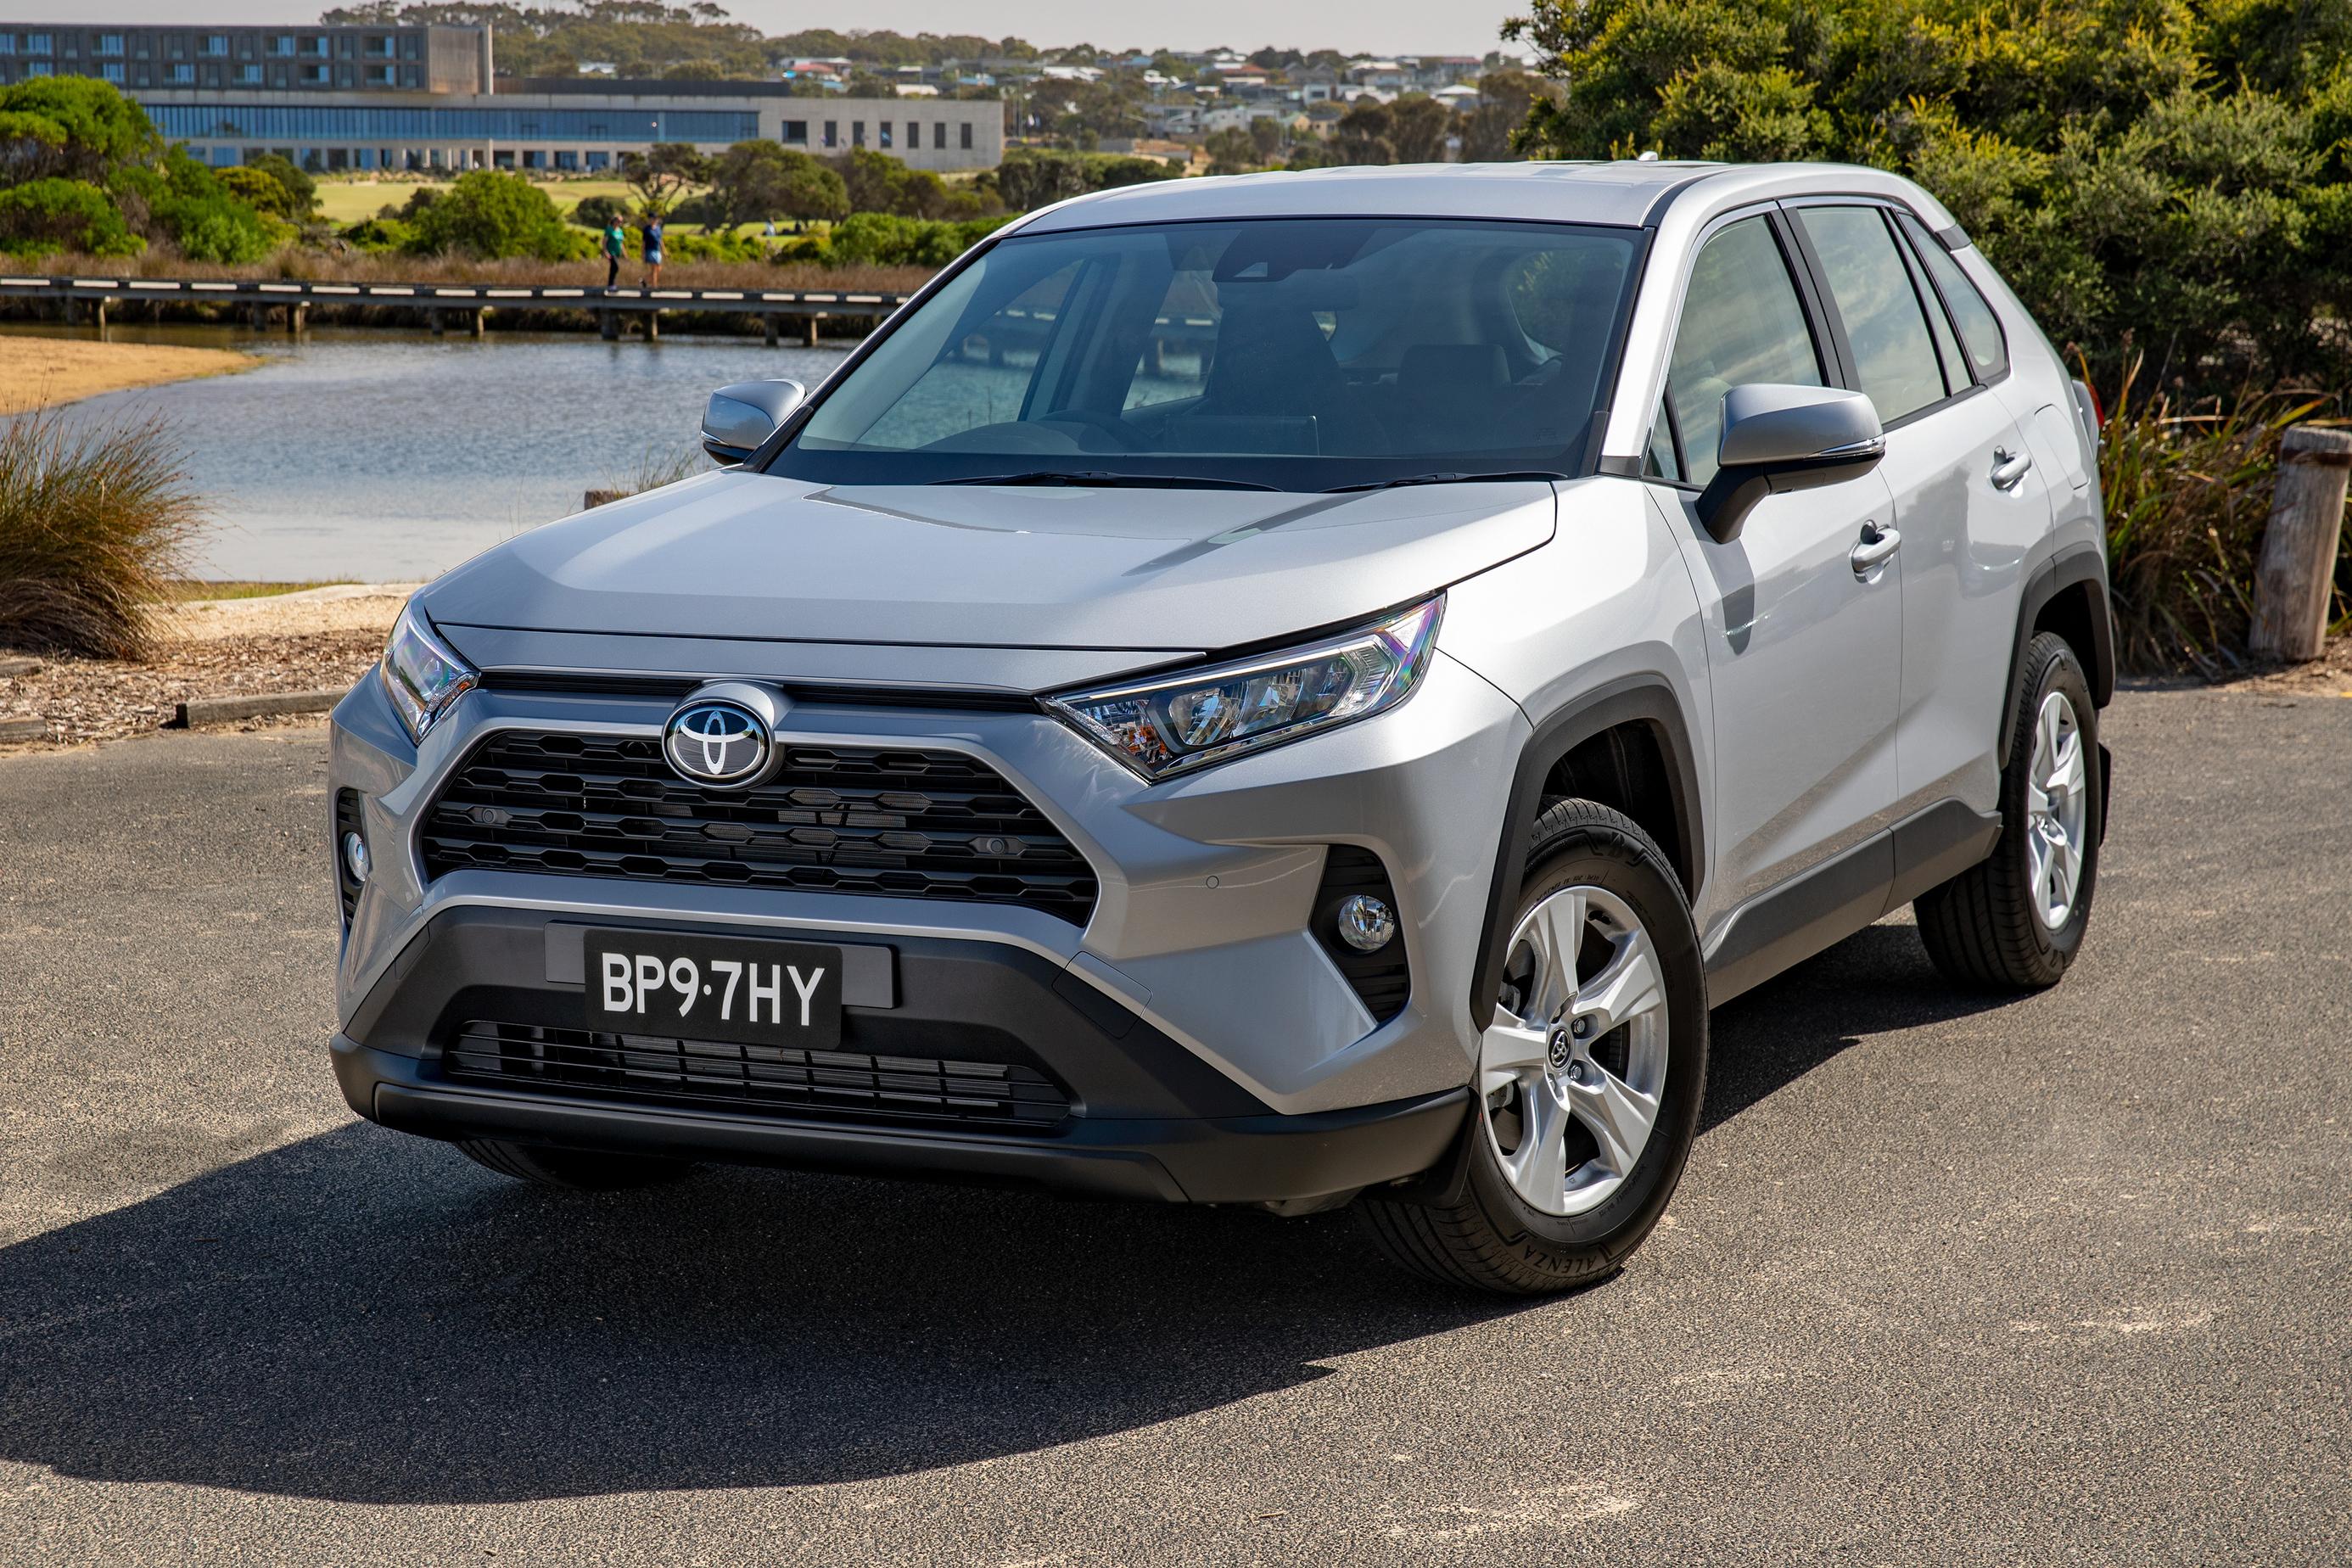
Toyota’s HiLux and Corolla continue to trail it, while the Hyundai i30, Mitsubishi Triton, Mazda 3, Toyota Camry and RAV4 are within almost 300 sales of each other.
The Holden Commodore – once Australia’s best-selling new car and a popular choice for used buyers – continues to sit outside the Top 10, despite being the sixth-most popular used vehicle in Australia last year.

The AADA and AutoGrab offer the following definitions for the monthly Automotive Insights Report:
- For Sale: Level of available used and demo cars listed online by dealers and private sellers nationally at the time of reporting. AutoGrab processes and de-duplicates listings to identify and eliminate repetitions, ensuring that vehicles listed across multiple platforms are counted only once.
- Sales: Total vehicles delisted from online marketplaces, serving as a close proxy to actual sales and recorded monthly. The delisting count also reflects unique vehicles, as AutoGrab processes and deduplicates listings to identify and eliminate repetitions, ensuring that vehicles listed across multiple platforms are counted only once.
Best-selling used cars (up to 10 years old)
Used car sales by state and territory
| State/territory | Vehicles listed | Vehicles sold |
|---|---|---|
| New South Wales | 84,807 (-4.9%) | 60,728 (+13.6%) |
| Victoria | 76,859 (-9.2%) | 51,076 (+14.1%) |
| Queensland | 65,714 (-2.2%) | 50,163 (+11.1%) |
| Western Australia | 26,953 (-1.8%) | 28,263 (+9.2%) |
| South Australia | 18,700 (-7.2%) | 14,680 (+11.3%) |
| Tasmania | 5455 (+0.3%) | 4569 (+2.2%) |
| Australian Capital Territory | 4632 (-22.6%) | 3627 (+1.4%) |
| Northern Territory | 2013 (-14.8%) | 1482 (-15.6%) |
| Total | 285,133 (-5.8%) | 214,588 (+11.6%) |
Sales by vehicle type
| Listed for sale | Total sales | |
|---|---|---|
| Passenger cars | 111,318 (-4.8%) | 88,686 (+13.1%) |
| SUVs | 107,995 (-7.9%) | 82,895 (+11.8%) |
| Utes | 55,359 (-4.2%) | 36,603 (+8.2%) |
| Vans and buses | 10,461 (-3.3%) | 6404 (+8.9%) |
Sales by fuel type
| Vehicle type | Sales (July 2024) | Change from June |
|---|---|---|
| Petrol | 138,371 | +12.8% |
| Diesel | 65,593 | +9.0% |
| Hybrid | 8382 | +12.3% |
| EV | 1786 | +12.8% |
| LPG | 258 | +12.2% |
| Plug-in hybrid (PHEV) | 198 | +28.6% |
Average retained value
| Vehicle type | Average retained value |
|---|---|
| Passenger (2-4 years old) | 82.1% |
| Passenger (5-7 years old) | 68.1% |
| SUV (2-4 years old) | 76.3% |
| SUV (5-7 years old) | 60.7% |
| Light commercial vehicles and utes (2-4 years old) | 77.8% |
| Light commercial vehicles and utes (5-7 years old) | 67.2% |
MORE: How used car sales are booming in Australia
MORE: Used vehicle sales surge in Australia, driving down prices for buyers
MORE: Used car sales April 2024: Hybrids and EVs defy slow market
MORE: Used car sales March 2024 – Market up, EVs see big gains
MORE: Used car sales drop, but they’re selling more quickly
MORE: Used car sales rise in strong start to 2024
MORE: Used EV, PHEV sales drop even as demand for new ones grows
MORE: Australia’s best-selling used cars in December 2023
MORE: Australia’s used car sales results for 2023 revealed
[ad_2]
Source link